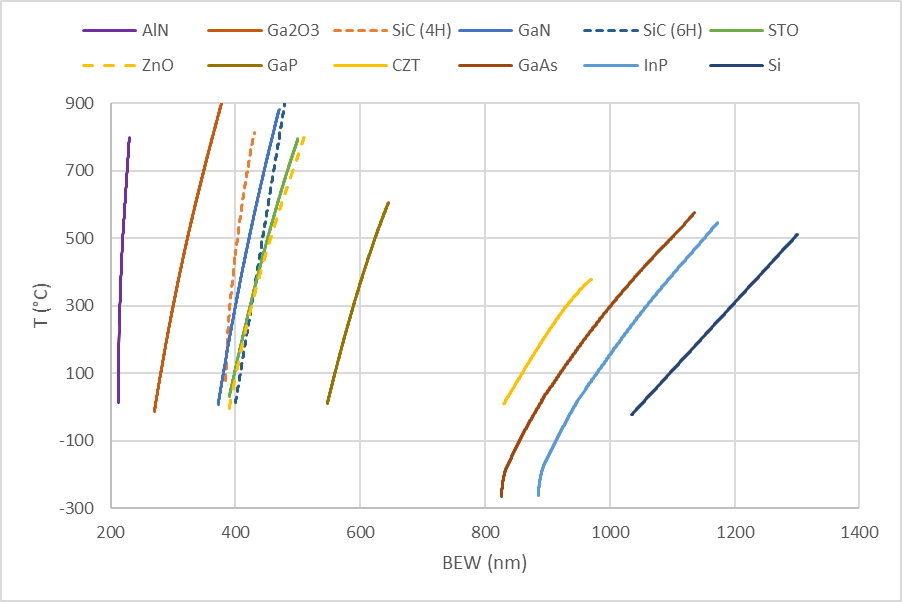
To show the wide range of materials and temperature ranges that the kSA BandiT tool can measure, we have put together a plot showing temperature vs band edge wavelength for the various materials that kSA BandiT can measure.
The calibration curves show a summary of kSA BandiT calibration files for various material substrates, ranging from the ultraviolet to the near infrared. As our customers know, kSA BandiT relies on our patented technique of directly measuring the band edge of the material and mapping this value to the absolute temperature of the material thru the proper calibration curve. kSA BandiT can measure substrate temperatures from ~ -250C all the way up to over 1000C (depending on the material). The graph below shows the temperature vs. band gap dependence (as determined using kSA BandiT) for AlN, Ga2O3, SiC (4H), GaN, SiC (6H), STO, ZnO, GaP, CZT, GaAs, InP, and Si. Note the cryogenic data for GaAs and InP, and the significant increase in slope as the temperature reaches cryogenic values.
The kSA BandiT temperature monitor utilizes the temperature-dependent absorption edge of semiconductor materials to determine substrate temperature[1]. The absorption edge position is directly related to the band gap energy of the material, which, in turn, is temperature dependent. While both empirical and theoretical equations exist for band gap dependence on temperature for most materials of interest, in practice these equations do not consider doping effects, scattering, and instrument response. As a result, it is much more accurate to generate experimental calibration curves or lookup tables that map a measured absorption edge wavelength to a previously calibrated temperature value. To learn more about the procedure for calibrating kSA BandiT systems for absolute temperature measurement, and how independent confirmation of the calibration using known RHEED (Reflection High Energy Electron Diffraction) transition temperatures on (100) GaAs substrates is done, read the kSA BandiT Temperature Calibration application note.
[1] M.K. Weilmeier et al, Can. J. Phys. 69, 422 (1991), C. Lavoie et al, J.V.S.T. A 10, 930 (1992).