Application Notes : kSA 400 – IDL Customization in kSA 400
Version: 1.0
Introduction and Motivation
IDL, short for Interactive Data Language, is a powerful programming language used to process large amounts of data and/or digital images. First developed in the 1970s at the Laboratory for Atmospheric and Space Physics (LASP) at the University of Colorado at Boulder, IDL has been widely applied in industries that require high-speed digital image processing and real-time data analysis. Some of the more prominent industries that use IDL are atmospheric physics, space sciences, and medical imaging.
kSA 400 Application Customization is an individually-licensed feature that gives users the flexibility to write their own analysis routines in the IDL programming language, and then have those routines compiled and executed within the kSA 400 measurement loop. We made this capability available for two types of data analysis: Simple two column data (x,y), and images. In either case, as long as the procedure is written properly and placed in the correct folder location, it will be compiled immediately upon launch of the kSA4 00 software and will then appear as a custom analysis filter in the analysis menus.
This application note gives an overview of how to use this feature within the kSA 400 software.
Sample IDL Procedure
The Application Customization feature must first be enabled before it can be used. This feature is sentinel-key enabled. Once enabled, it can be accessed by selecting Options from the main menu. The kSA software provides a simple, dialog-based setup of the customized processing routines. The following procedure will demonstrate how to create a custom data filter that will invert your data (change peaks to valleys, etc.).
Note: This is a very elementary example of how to create a custom filter using IDL. You will need to be familiar with the IDL language and syntax before attempting more complex programming.
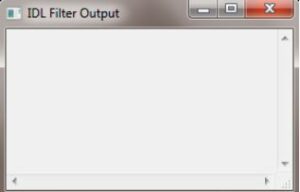
- 1. Click the View option from the main menu bar, followed by the IDL Filter Output option. This will bring up a blank IDL Filter Output dialog that will allow you to compile your procedure once you’ve finished. This step must be performed before creating a new procedure.
IDL Filter Output dialog
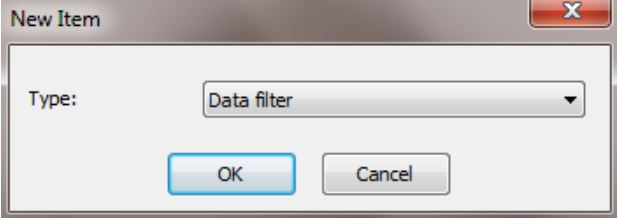
- 2. Select Options from the main menu bar, followed by Application Customization. The following dialog will be displayed:
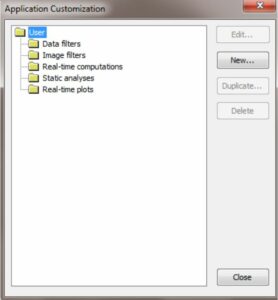 Application Customization dialog
Note: You can generate IDL procedures to operate on any of the five data types shown in the image above.
- 3. Click the New button in the Application Customization window and then select the Data Filter type. Click OK.
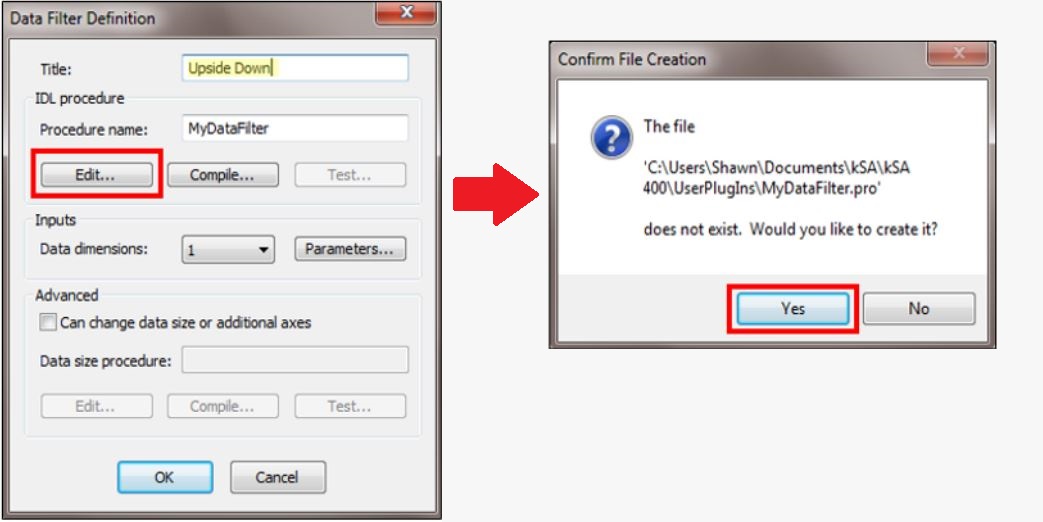
- 4. In the Data Filter Definition dialog, type the name “Upside Down” in the Title field.
- 5. Under the IDL procedure header, click the Edit button. When you are prompted to create the .pro (procedure) file, click Yes.
Data Filter Definition dialog
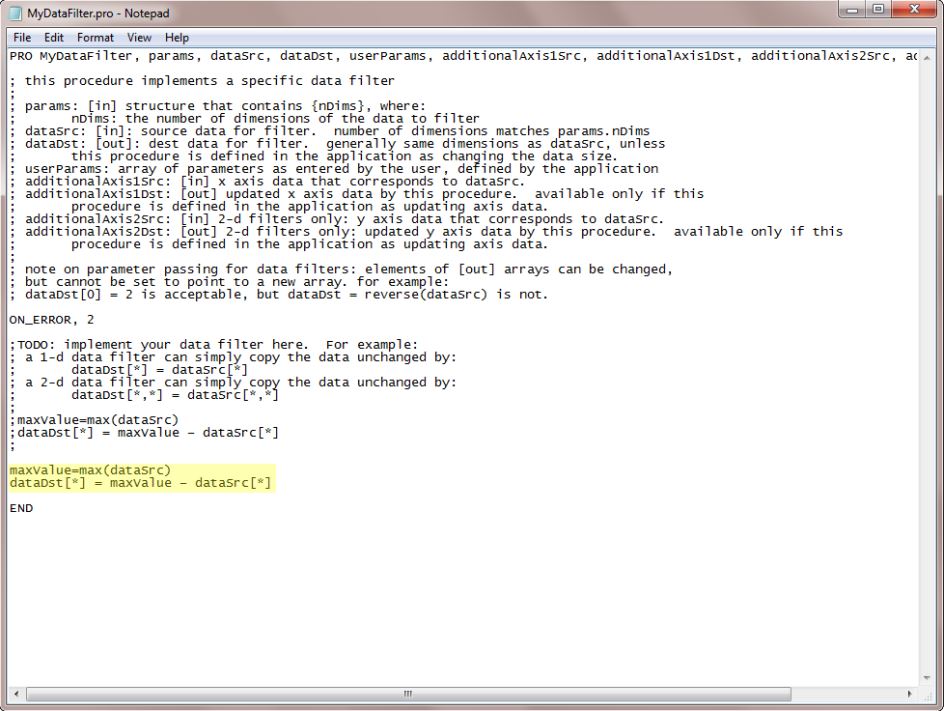
- 6. Scroll down to the bottom of the generated .pro file and add the following two lines before the END statement:
maxValue=max(dataSrc)
dataDst[*] = maxValue – dataSrc[*]
- 7. Click File/Save but leave the .pro file open.
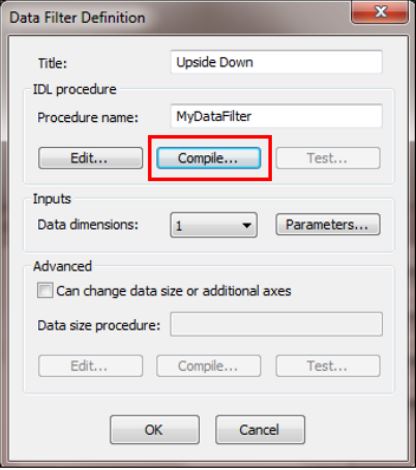
- 8. Click the Compile button in the Data Filter Definition dialog (next to the Edit button). This dialog may be hidden behind other windows.
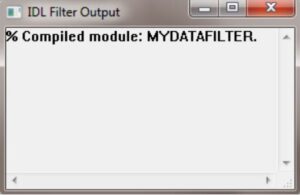
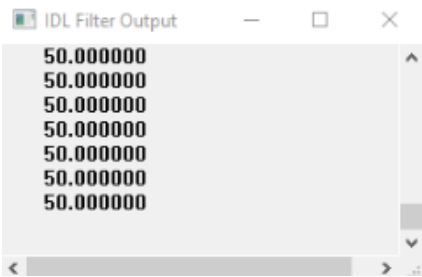
At this point the software will perform a quick check of your procedure to make sure it doesn’t contain errors that would prevent it from executing. Any errors that it finds will be displayed in the IDL Filter Output dialog. Fix any errors, Save the file, and then click the Compile button again until all errors have been corrected. If there are no errors in your procedure, the following message will appear in the IDL Filter Output dialog:
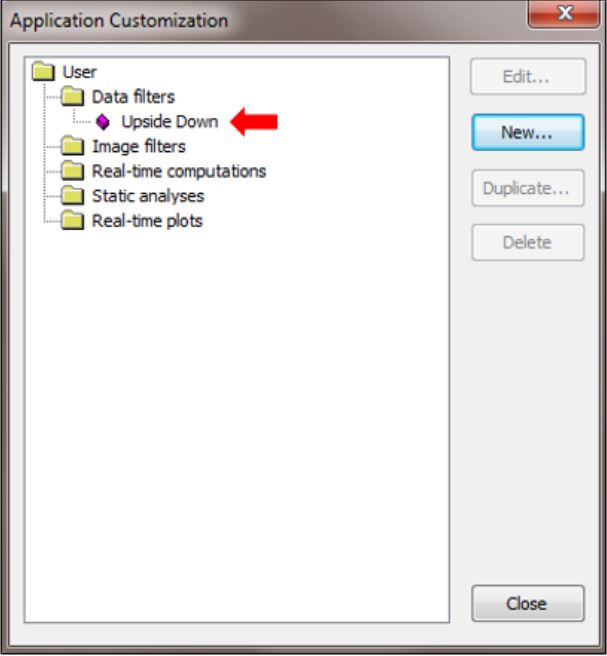
- 9. Once you’ve successfully compiled your procedure and any/all errors have been resolved, click OK in the Data Filter Definition dialog box to close it. Your new “Upside Down” data filter will appear in the folder tree of the Application Customization dialog.
Newly-created “Upside Down” data filter
- 10. Click Close on the Application Customization dialog to save your new configuration and update the application.
Note: The simple act of opening and closing the Application Customization dialog results in the reload and configuration of all programming items. This is the main mechanism for updating the processing whenever an IDL procedure has been modified.
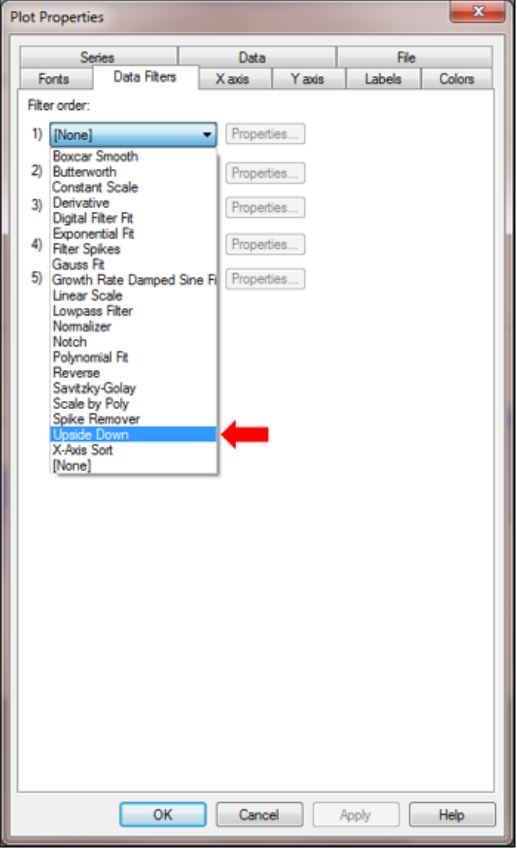
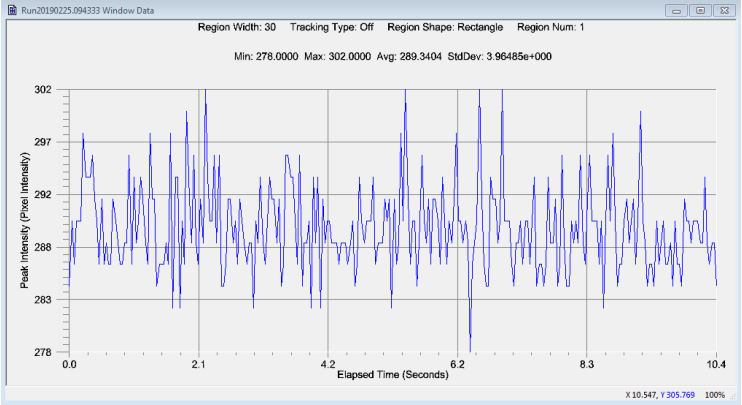
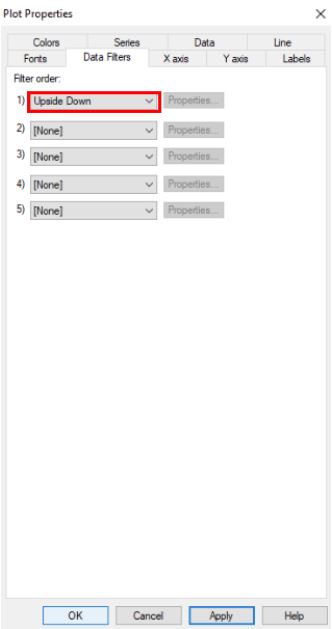
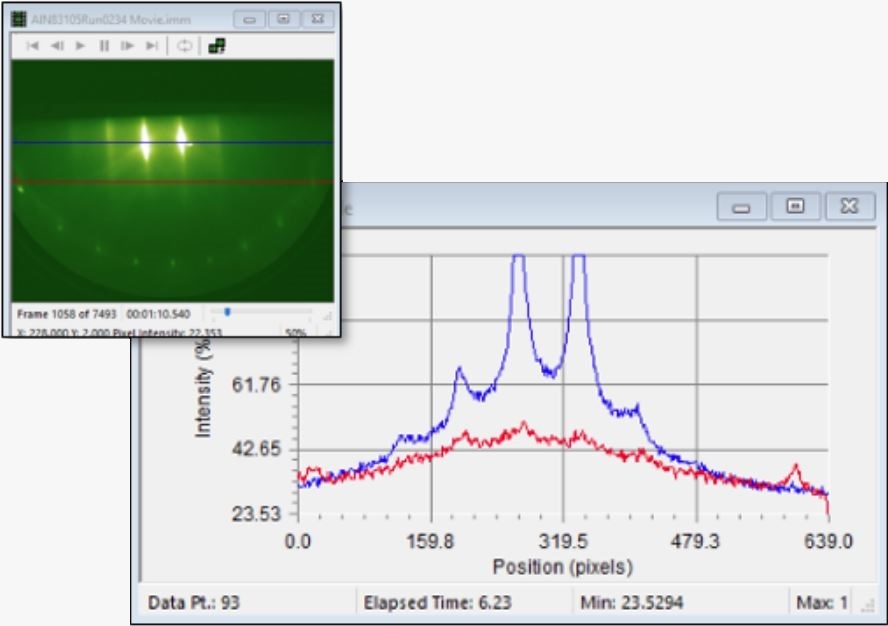
- 11. To test the new filter, use a line plot from any acquired image. Right click inside the plot and click Properties, then click on the Data Filters tab. Select the Upside Down filter and then click OK. Note that the plot peaks will flip and now become valleys.
Selecting the new filter in the Plot Properties dialog
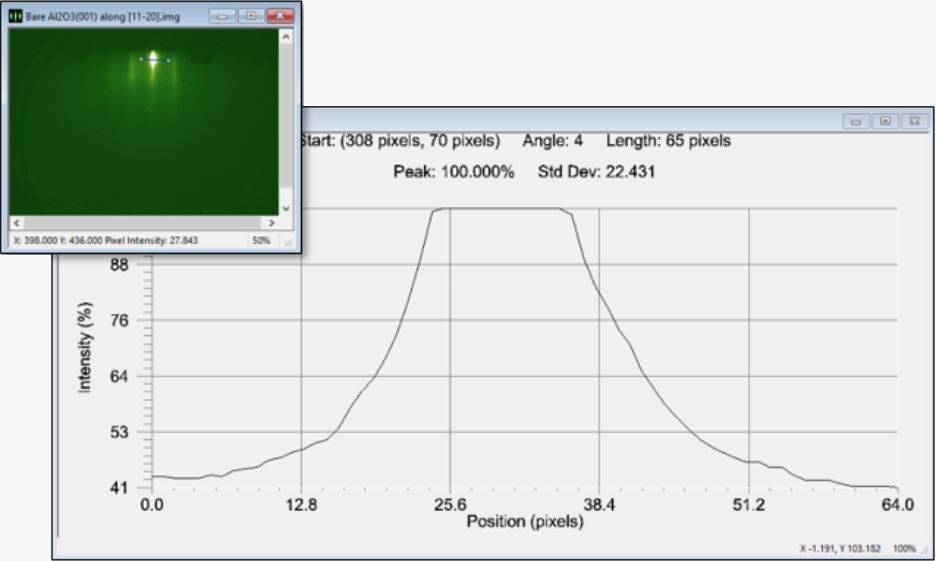
Plot before filter applied
Plot after filter applied
Monitoring IDL
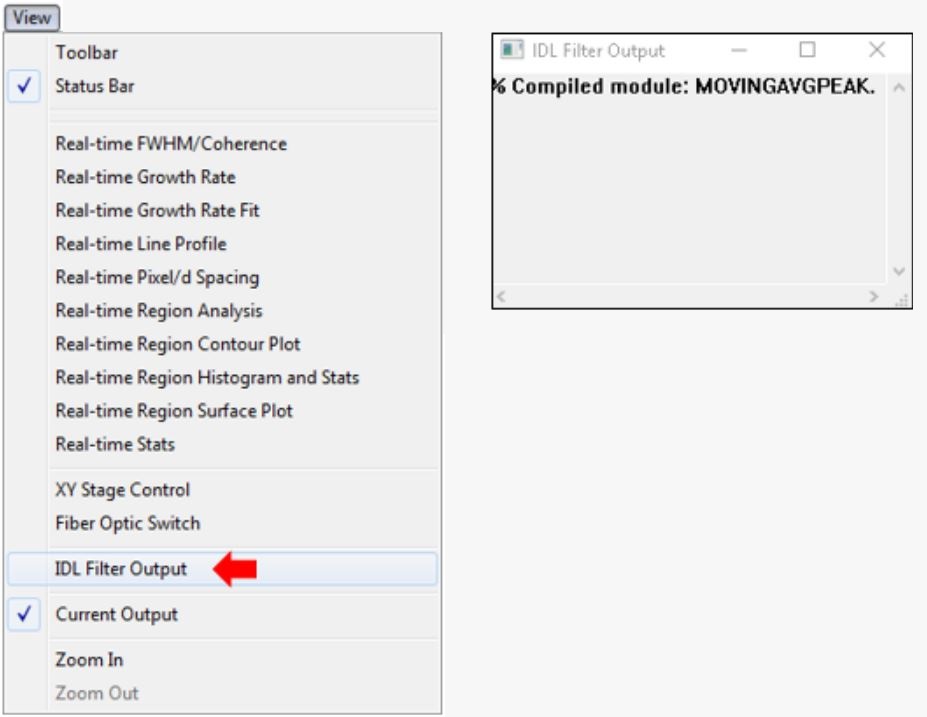
By selecting the View menu and then the IDL Filter Output option, you can monitor the IDL print output window to aid in debugging your custom procedure/filter.
IDL Filter Output option
To compile a procedure, click Options from the main menu, followed by Application Customization. Choose a filter to compile and then click the Edit button (make sure the IDL Filter Output dialog is opened). Click the Compile button.
Any errors that the compiler finds will be displayed in the IDL Filter Output dialog. At this point you can make any necessary changes, save the file, and then re-compile until the procedure is clean and ready for processing.
Adding a Print Statement to an IDL Routine
IDL also supports adding a print statement to the end of the routine/procedure in order to output a value or set of values. Where the kSA 400 software outputs this value/values will change depending on how the filter is being applied.
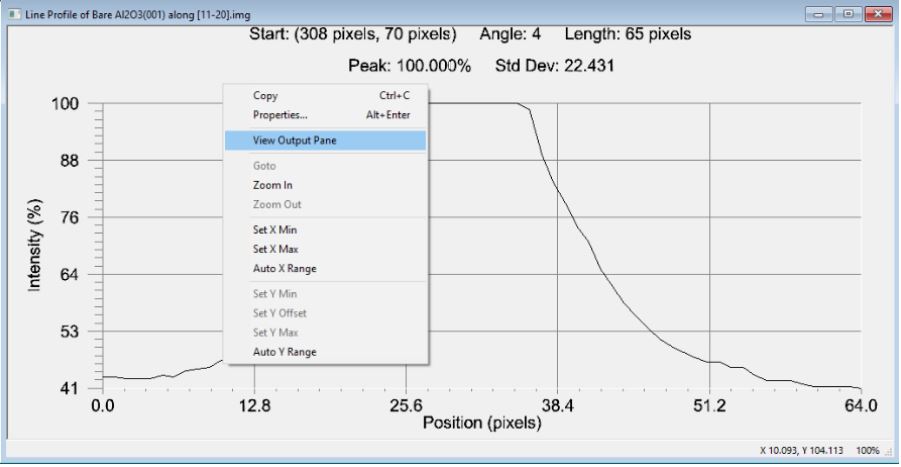
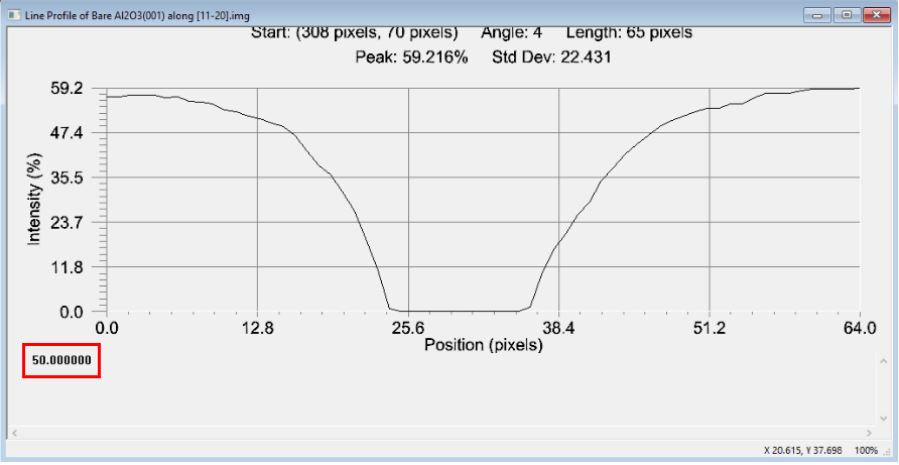
For example, for filters applied to static images, print statements are set to appear in the output pane under the chart that you are filtering. This is done by right clicking inside the chart and then selecting the View Output Pane option, as shown below.
View Output Pane option in a Line Profile plot
In this case, adding the statement print, maxValue/2 to the end of the Upside Down filter that you created earlier will result in your data being flipped and an output of half the max value, which is 50.
Result of print statement
If you apply a filter to a real time line profile instead of a static image, the values will output to the IDL Filter Output dialog that appears when you select View, followed by IDL Filter Output.
Refer to the procedures below for examples on how to add print statements for both scenarios mentioned above.
Example #1: Print Output with Static Line Scan
- 1. Click Options, followed by Application Customization and then select the Upside Down data filter that you created earlier in the Sample IDL Procedure section.
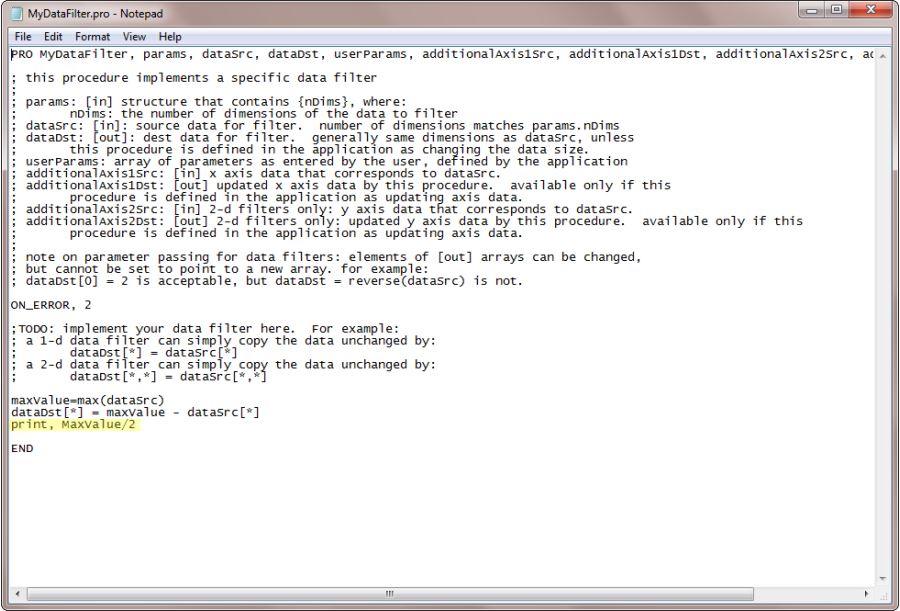
- 2. Click the Edit button and enter the following print statement to the end of the code:
print, maxValue/2
Adding a print statement to the Upside Down procedure
- 3. Save and Exit the text file, and then click the Compile button to make sure that everything compiles correctly.
- 4. Double click on an image from the RHEED image library to open it.
- 5. Select Analysis from the main menu, followed by Line Profile.
- 6. Drag the line on the image and place it across a region of interest.
Choosing an area of interest
- 7. Right click inside the line profile plot and select Properties.
- 8. Click the Data Filters tab and choose the Upside Down filter from the first available drop-down.
- 9. Click OK and the data in your line profile plot will flip. Notice that you will not see the print output inside the IDL Filter Output dialog.
- 10. Right click again in the Line Profile dialog, this time choosing the View Output Pane option.
View Output Pane option
You now have a displayed output that corresponds to half the max value (100/2), or 50.
Result of print statement
Example #2: Print Output with Real-time Line Scan
Note: The following procedure assumes that the print, maxValue/2 statement used above has already been added to the Upside Down data filter code.
- 1. In the kSA 400 software, click View from the main menu, followed by the IDL Filter Output option. This is the dialog where the print output will be displayed.
- 2. Select Acquire from the main menu, followed by Scan Mode.
- 3. Open a movie file from the RHEED image library (you can also use your camera as a source).
- 4. Click on the Line button in the Add new region section.
- 5. Place the new line over any area of interest.
- 6. Open the real-time chart by selecting View from the main menu, followed by Real-time Line Profile.
- 7. Click the Start button in the Scan Mode dialog to ensure that you are collecting data on your real-time profile as the movie plays.
- 8. Right click inside the Real-time Line Profile chart (it may be hidden behind other windows) and select Properties.
- 9. Click the Data Filters tab and choose the Upside Down filter from the first available drop-down. If you’ll recall, we edited the Upside Down filter earlier by adding the following print statement at the end:
print, maxValue/2
- 10. Click OK.
- 11. Click the Start button again in the Scan Mode dialog. The line profiles should flip upside down and the print statement should begin populating in the IDL Filter Output dialog. This print statement should update in real-time while the scan is running.
Setting Your Personal Application Folder Location
- Select Options/General from the main menu, and then click on the Directories tab. The path displayed in the Personal field is the folder where user folders are placed.
- Click on the folder icon at the right to browse to a different folder if desired.
Location of User Programs and the Configuration File
Custom procedures/programs that are written by the user are stored in the UserPlugIns folder, which is a subfolder of the Personal folder mentioned above. The UserPlugIns folder contains a standard configuration file named User.apcf and also any user-written IDL .pro files.
Viewing the User Configuration File
The configuration file (user.apcf) describes how each custom routine will be called, and also explicitly details the associated inputs and outputs.
Note: The kSA user interface does not provide complete customization of the configuration file
Real-Time Computations in the Configuration File
Source Columns
A source column is a named value calculated by the kSA software for every data measurement. A source file can be provided to the customization routine in order to compute a derived value.
The following section in the configuration file describes each source column:
[User_RT_ColumnComputers_List_0_Definition_SourceCols_List]
The description starts with how many total source columns are configured (Num= ).
Each configured source column has its own section labeled with its number:
[User_RT_ColumnComputers_List_0_Definition_SourceCols_List_0]
The definition includes the following:
| Field | Description |
|---|---|
| Description | English name of the source column. |
| ColumnID | The ID of the column (from the table below). |
| UnitsID | The units of the column (from the table below). |
| IndexByID | Signifies if the column is indexed (from the table below) |
| StatsType | An internal kSA field |
[User_RT_ColumnComputers_List_0_Definition_SourceCols_List]
Num=1
[User_RT_ColumnComputers_List_0_Definition_SourceCols_List_0]
Description=Peak Intensity – Default (Pixel Intensity) Region No.
ColumnID=1
UnitsID=5
IndexByID=3
SampleStatType=16777215
Units
| Unit Name | Unit ID |
|---|---|
| UnitsDefault | 1 |
| UnitsSeconds | 2 |
| UnitsVolts | 4 |
| UnitsAbsoluteIntensity | 5 |
| UnitsPercentIntensity | 6 |
Index
| Index Name | Index ID |
|---|---|
| IndexDefault | 1 |
| IndexByLine | 2 |
| IndexByWindow/Region | 3 |
Columns
| Column Name | Column ID | IndexBy | Units |
|---|---|---|---|
| AbsElapsedTime | 0 | 1 | 1 |
| PeakIntensity | 1 | 3 | 5 |
| SummedIntensity | 2 | 3 | 5 |
| AverageIntensity | 3 | 3 | 5 |
| CentroidIntensity | 11 | 3 | 5 |
The following is an example of a User.apcf file that was properly set up with peak intensity as a source column:
Note: UnitsID and IndexByID must be set to these values
[User]
CustomizationLevel=2
[User_DataFilters_List]
Num=0
[User_ImageFilters_List]
Num=0
[User_RT_ColumnComputers_List]
Num=1
[User_RT_ColumnComputers_List_0_Definition]
DisplayName=MovingAvgPeak
ProcedureName=MovingAvgPeak
[User_RT_ColumnComputers_List_0_Definition_SourceCols_List]
Num=1
[User_RT_ColumnComputers_List_0_Definition_SourceCols_List_0]
Description=Peak Intensity – Default (Pixel Intensity) Region No.
ColumnID=1
UnitsID=5
IndexByID=3
SampleStatType=16777215
[User_RT_ColumnComputers_List_0_Definition_ResultCols_List]
Num=1
[User_RT_ColumnComputers_List_0_Definition_ResultCols_List_0]
Description=User-defined column 0 – Default n/a
ColumnID=36000
UnitsID=0
IndexByID=0
SampleStatType=16777215
[User_RT_ColumnComputers_List_0_Definition_UserParamDefList_ParamDefs]
Num=0
[User_RT_ColumnComputers_List_0_Definition_ResultColRanges]
Num=0
[User_RTCs_List]
Num=0
[User_StaticCharts_List]
Num=0
Conclusion
The use of IDL programming via the kSA 400 Application Customization feature allows you to customize your kSA 400 analysis capabilities. Once enabled, the kSA 400 software provides a simple, dialog-based setup of the customized processing routines to allow you to easily integrate your custom analysis routines into the kSA 400 application. For complex data processing implementations, a working knowledge of the IDL programming language is required.

