Application Notes : kSA BandiT– Hot MBE Sources BET vs. Pyrometry
Version: 1.0
Effects of Hot Sources on Substrate Temperature Measurement During MBE Growth: Band Edge Thermometry vs. Pyrometry
Background
Accurate measurement of substrate temperature during MBE growth is an important issue. High quality growth of some materials requires substrate temperatures to be held within a range of ~±8°C. Examples are InP and InAlAs lattice matched to InP. Since almost all MBE systems use rotating substrate holders that do not allow thermocouples (TC’s) to contact the substrate (or even the substrate holder), non-contact optical means are needed for true substrate temperature measurement, with the TC acting only as a reference point to provide feedback control of the substrate heater. At present the two main optical techniques used are infra-red (IR) pyrometry and band edge thermometry. Either of these techniques can be used for “outer loop” control of the substrate temperature, with the TC as the “inner loop” control. However, to use either technique for outer loop control, you must be sure that it is not subject to interference effects during growth that will produce incorrect temperature readings.
Pyrometric temperature measurements depend on measuring the light intensity in a restricted wavelength range. For instance, the most popular commercial pyrometer used for GaAs and InP substrates measures the intensity in the wavelength range of 0.91 to 0.97µm. Another way of looking at this is that it counts the number of photons per second arriving with an energy range of 1.278 to 1.363 eV. However, a pyrometer cannot distinguish between photons coming from the substrate and stray photons coming from other IR light sources in the MBE chamber. How much affect stray IR light has on the pyrometer temperature depends on two factors:
- The ratio of the intensity of the stray IR to the true IR signal from the substrate, and
- Whether the stray IR is steady-state or changing
Obviously, for cases where the substrate IR signal is high (the substrate is at high temperature), interference from stray IR may not be much of an issue, and may, in fact, be negligible. Even if the substrate temperature is low, if the stray IR is steady-state it may be possible to calibrate out its effect. The worst scenario for interference is when the IR light level coming from the substrate is relatively low, the stray IR intensity is relatively high, and the stray IR changes intensity rapidly. A concrete example of this is when the substrate is at relatively low temperature, one or more effusion cells are very hot, and the shutters over those effusion cells are opening or closing (i.e. – growth and/or doping starting and stopping). Note that although most MBE systems allow the pyrometer to be mounted on a port that does not experience specular reflection off the substrate from any of the effusion cells, IR light from the hot cells will still undergo multiple reflections and/or diffuse scattering within the growth chamber and be collected by the pyrometer. Specific examples of this situation will be given below. Partly due to the issue of the band gap transmission range of GaAs and InP substrates, and partly due to the sensitivity of the detector, commercial pyrometers can only measure substrate temperatures above ~400°C. The closer the substrate temperature is to this low end, the smaller the signal is, and the more subject the pyrometer temperature is to interference from stray IR. Furthermore, standard III-V substrates (GaAs, InP) are transparent in the 0.91-0.97 µm wavelength range for temperatures below ~400°C: hence at these low temperatures the pyrometer will see substrate heater radiation directly through the substrate, yielding a false high temperature reading.
There is a variation on traditional pyrometry called emissivity (ε) corrected pyrometry (ECP). This variation measures the reflectivity (R) of the wafer surface, and employs the relationship ε = 1-R (assuming the wafer is opaque) to correct the pyrometer reading for changes in the wafer emissivity due to effects such as growth of layers with differing indices of refraction (heteroepitaxy). The measurement of R is usually achieved by measuring the specular reflection from the substrate using an LED or laser source. However, this technique does not correct for the influence of stray light sources, for two reasons: 1) stray light still enters the pyrometer detector, adding to the apparent signal from the substrate and therefore causing the pyrometer to read a false high value 2) stray light will also enter the reflectivity detector (typically a photodiode), even if the detector has a line filter. This stray light will add to the apparent reflectivity value, thereby falsely lowering the emissivity of the substrate, and thereby falsely raising the temperature of the substrate.
In contrast to pyrometry, band edge thermometry (BET) measures the band gap of the substrate via spectroscopy. The band gap is determined by observing the wavelength at which the substrate changes from absorbing to transmitting light. Since the band gap varies with temperature in a known manner, measuring the band gap allows the temperature to be determined from room temperature up to very high temperatures (~700°C in the case of GaAs). Diffusely scattered IR light has little or no effect on the determination of the substrate temperature regardless of whether the substrate temperature is high or low.
Examples
The examples presented below were obtained on a Veeco GEN III MBE reactor equipped with both a popular, commercially available pyrometer and a kSA BandiT BET system. The pyrometer is mounted on the usual pyrometer port (which is not subject to specular reflections from the effusion cells). BandiT is mounted on an effusion cell port equipped with a window, but the diametrically opposed effusion cell, which could produce specular reflection into the BandiT detector, is not used for these growths1.
The first example to be presented is for the growth of 0.22µm of N+ InP on a semi-insulating InP substrate. Two In cells (each operating at ~810°C) were used to produce a combined growth rate of ~1.3 µm/hr. The Si cell was at a temperature of 1418°C in order to produce a doping of ~2e19 electrons/cm3. As can be seen in Figure 1, Ts (substrate temperature) is 471°C before growth starts. When the In and Si shutters open (at ~340 seconds), the pyrometer Ts jumps immediately to ~499°C, but the Ts from BandiT shows a slow climb to ~478°C by the end of the layer. A rise of a few degrees during the 10 minutes this layer is deposited is entirely reasonable, based on the extra heat load from the cells plus extra free carrier absorption due to the heavily doped epilayer, and this is exactly what BandiT shows. On the other hand, the instantaneous 28°C jump at the start of growth shown by the pyrometer is virtually impossible, based on the size of the GEN III substrate holder, which accommodates up to 4 inch diameter wafers. The same reasoning applies to the response of the two techniques at the end of this layer: BandiT shows a reasonable, slow drop of Ts after the shutters close, while the pyrometer shows an instantaneous drop back to close to the starting Ts.
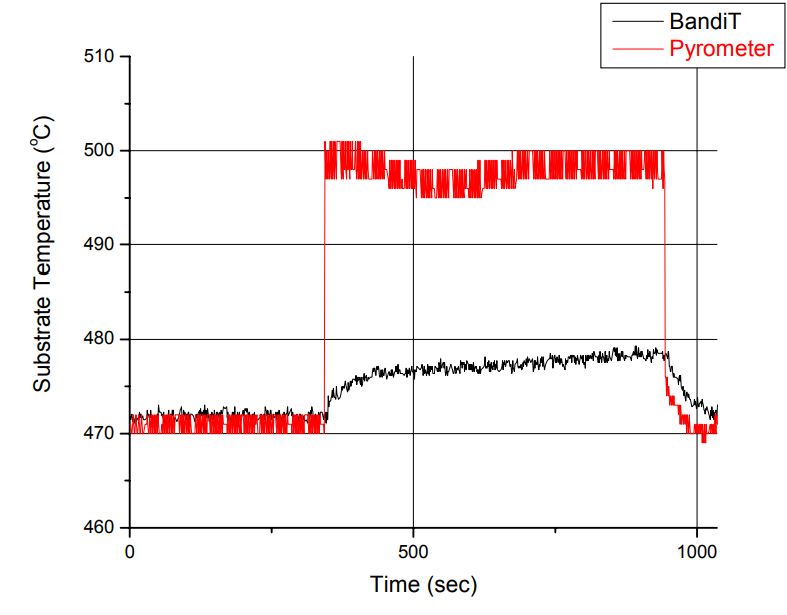 Figure 1: Growth of N+ InP on a semi-insulating InP substrate.
The second example is the growth of 0.20µm of N+ InAlAs on N+ InP. This is actually a continuation of the growth started in Figure 1. The InAlAs is lattice matched to the InP, and the growth rate is ~1.20 µm/hr. In this case, one In cell (operating at ~810°C), one Al cell (operating at 1139°C), and the Si cell at 1418°C were used. Similar behavior to the previous example can be seen. In this case, the pre-growth Ts is ~522°C. When the shutters open at ~1480 seconds, the pyrometer signal instantaneously jumps by 13°C, up to ~535°C. In contrast, the BandiT signal shows a much more reasonable slow rise to ~526°C. Again, at the end of the layer growth, the pyrometer drops immediately back to close to the starting Ts. The smaller pyrometer temperature jumps of the second example compared to the first one are presumably because the starting Ts is ~50°C higher, and therefore the larger “true” signal to the pyrometer is less affected by roughly the same amount of stray photons from the hot sources.
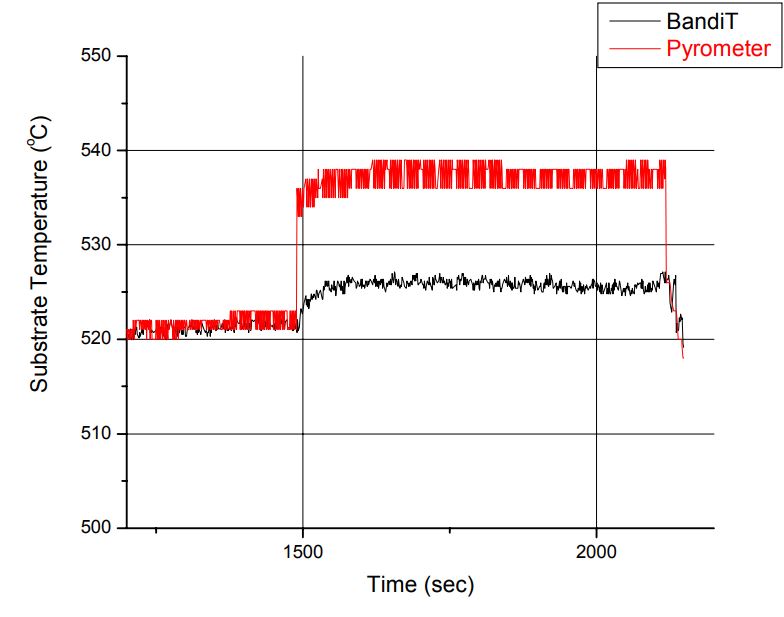 Figure 2: Growth of N+ InAlAs on N+ InP.
1R. N. Sacks et al, “Growth Related Interference Effects in Band Edge Thermometry of Semiconductors”, J. Vac. Sci. Technol B
23, 1247 (2005).
Conclusions
We have shown that hot material sources can interfere significantly with measurements of Ts by pyrometer, to the point that attempting to use the pyrometer signal for outer loop control of Ts can result in poor quality growth. In contrast, BET is immune to spurious diffuse IR signal, and only shows actual Ts changes due to real heating effects.