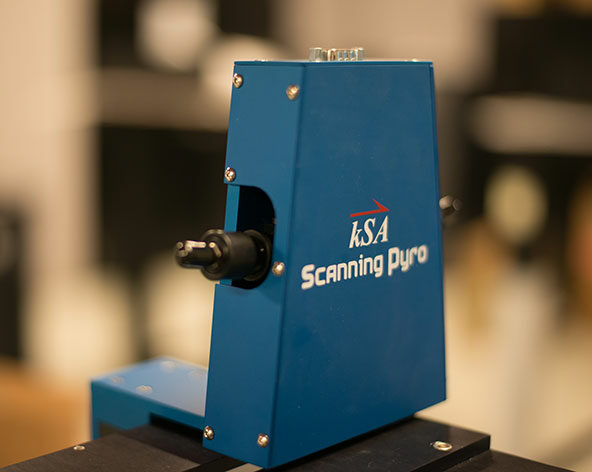
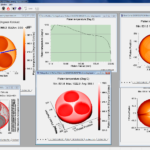
For use on Veeco K465i and EPIK700 MOCVD reactors, the kSA ScanningPyro performs automated temperature mapping in order to measure temperature variations across wafer carriers and wafers. Use it to tune heater zones and optimize process and hardware to achieve higher yields, wafer uniformity and device performance.
 MOCVD fabs often perform spot temperature measurements on wafer carriers to help tune the heater zones in an attempt to achieve uniform temperature profiles.
For reactors with slit style optical access, like Veeco K465i and EPIK700 MOCVD tools, the kSA ScanningPyro provides the ability to generate high resolution full temperature maps of wafer carriers and wafers, greatly enhancing the ability to perform process optimization.
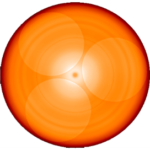
The kSA ScanningPyro combines simultaneous temperature measurements from a dual scanning pyrometer head to map the entire wafer carrier, from center to outer edge, in under 2 minutes on Veeco K465i reactors. Users acquire wafer carrier maps, selectable line scans, and/or subsets of the full scan. Easily perform analysis with proprietary kSA software to identify problem areas. With this information in hand, users are better equipped to make process and hardware adjustments to improve product performance.
Temperature
kSA ScanningPyro provides full wafer carrier temperature mapping and analysis. Using a dual sensor pyrometer, it scans from carrier center to carrier edge in a single automated scan. The kSA ScanningPyro is typically configured for a temperature range of 530°C to 1250°C with temperature resolution of better than ± 0.2°C for carrier temperatures above 650°C. The measurement spot size is less than 1mm in diameter, providing high resolution across the carrier.
Scanning
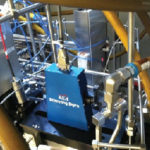
kSA ScanningPyro is equipped with a high resolution linear scanning stage, with a software configured step size down to 0.05mm. This stage along with the kSA ScanningPyro optical head are aligned with the slit style optical viewport in the MOCVD reactor lid which allows full access to the wafer carrier. For a carrier radius of 232.5mm and a 1mm step size, a full temperature map on a K465i reactor is completed in under 100 seconds! Moreover, it acquires thousands of data points per carrier radii, which allows an angular resolution better than 0.3°. kSA ScanningPyro also allows temperature measurement at selected carrier radii or over a user defined annular region. The scan parameters, including starting and stopping radius and scanning step size, are user-selectable. As such, the customized scanning recipes can be saved in order to perform fully automated temperature scans with automated statistical analysis for quick an easy carrier evaluation
Data Display and Analysis
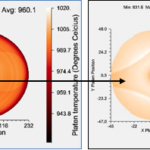
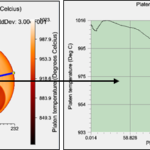
kSA ScanningPyro performs fully automated temperature scans with automated statistical analysis for quick an easy carrier evaluation based on user defined scanning and analysis recipes. Line Profiles, 2-D and 3-D plots, and statistical analysis plots are some of the ways to display this data. A user defined circular or rectangular area of the carrier map can be displayed in separate windows for a “zoomed in” view in real-time or post acquisition. With the line profile selection tool, the user can place the line profile at any position, length, and line width, which allows for in depth analysis of the temperature profile across the carrier. Statistical analysis of the data using the mean, median, and standard deviation can help identify significant variations and can be used you to improve process control and wafer yield. All data may also be exported to an SQL database for further customer analysis and archiving.
